The Cheshire cat in Alice’s Adventures in Wonderland comes and goes at will, and engages Alice with baffling philosophical points. Chemical bonds are a bit like that too. In the previous post, we saw how (some) bonds can be tuned to be strong or weak simply by how a lone pair of electrons elsewhere in the molecule is oriented with respect to the bond. Here I explore another way of looking at bonds. To start, we must introduce a quantity known as ∇2ρ(r), henceforth termed the Laplacian of the electron density ρ(r).
Firstly, a recipe: obtain a description of the electron density distribution in the molecule; we will call this the wavefunction (and programs such as Gaussian can write this out in something called a wavefunction file, or .wfn). In a cube of space enclosing the molecule, at each point obtain the second derivatives of ρ(r) with respect to the x, the y and the z coordinate of the point, and populate a (3,3) matrix with the values. Diagonalize the matrix, and add the three eigenvalues of the matrix at that point together to get ∇2ρ(r). Repeat this procedure at regular intervals for all the other points in the cube of space (typically ~200 points in each of the three directions). You will end up with a cube of (in this case 8 million) Laplacian values for the molecule.
Typically (in atomic units), any one value may range from ~-1.0 to ~+1.0, but more meaningful insight is obtained by a (local-virial theorem) expression which relates the Laplacian to a sum of the potential and kinetic energy densities (see. eg here for more detail). A negative Laplacian is dominated by a lowering of the (negative) potential energy at that point in space, whereas a positive Laplacian arises by a domination of the (positive) excess kinetic energy. Measured at the ~mid-point of a (homonuclear) bond, the former indicates an attractive covalent bond, whereas the latter will indicate either an ionic bond or a third type known as charge-shift in which the covalent term (in the valence-bond description of the bond) is repulsive rather than attractive (the actual bond binding energy arises from resonance terms between the covalent and ionic structures). A -ve Laplacian is describing local accumulations or concentrations of (bonding) electron energy densities, whereas a +ve value is describing local depletions. The former can also be used to identify a Lewis base or nucleophilic region, and the latter a Lewis acid or electrophilic region.
Now that we have a cube of points describing the Laplacian for the molecule, we can look at the surface defined by any particular (positive or negative) value of the function to see what insight, if any, can be obtained. Time for some pictures.

Ethane. Laplacian isosurface +/- 0.3 Click for 3D
The above is ethane, contoured at a Laplacian isosurface value of either -0.3 (red surface) or +0.3 (blue surface). Interpreted simply, all seven bonds in this molecule coincide with the red components, which can be taken as typical covalent interactions. The blue spheres represent the valence atomic orbital regions, which have been depleted at the expense of the bond. Nicely intuitive thus far. Let us contour the Laplacian at a rather lower value of +/- 0.2.

Ethane, Laplacian isosurface +/- 0.2 Click for 3D
New blue features have appeared which correspond to +ve Laplacian values. Close inspection reveals them to coincide with what we might describe as the anti-bonding regions of each bond (eight in all). They have been named σ-holes. Indeed, one might reasonably expect a depletion from just those regions in favour of the bonding regions (one might also regard it an electrophilic region, susceptible to eg nucleophilic attack). Well, we could explore both lower and higher values of the Laplacian (for example, a value of either -0.511 or -0.869 happens to have special significance for the C-C or C-H bonds of ethane) but to keep this blog short, I will move on to (and conclude with) benzene, another iconic molecule.

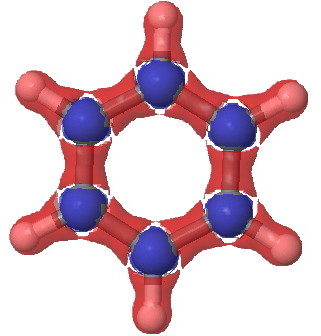
Benzene. Laplacian isosurface +/- 0.3 Click for 3D

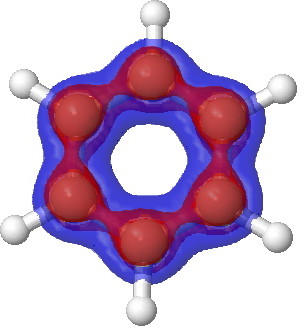
Benzene. Laplacian isosurface +/- 0.2 Click for 3D
Again, the +/- 0.3 isosurface has the expected red bonds, and at the lower value, further blue regions (it is tempting, but we really should not call them anti-bonds!) materialize. Look at the central region of the ring, where depletion seems to have happened.
I close with a musing. Firstly, it is noteworthy that the Laplacian can actually be measured, it is not merely a theoretical concept (although the experiments are in fact pretty difficult, and need very specialised apparatus) but a real observable. Secondly, (at certain values) the Laplacians do seem to recover the simple picture of covalent bonding. The issue really is how far to push the analogy and whether in fact it results in any significant additional insight compared to more conventional ways of representing bonds. At least the pictures are pretty!
Postscript: One can use a sub-set of electrons to calculate the Laplacian. Shown below is benzene calculated for just the σ and π-electrons.
 Benzene, σ-manifold |
 Benzene. π-manifold |
Notice how the σ set does not differ much from the total set, but the π-set shows accumulation above and below the plane, at the expense of depletion in the plane (one must be aware that integration of the Laplacian over all space should yield the value of zero). This explains the unusual features of the total set at the 0.2 theshold above.
Tags: actual bond binding energy, Alice's Adventures in Wonderland, chemical bonds, electron energy densities, excess kinetic energy, Interesting chemistry, potential and kinetic energy densities, potential energy
Henry, great post! Question: the electron density does not care about bond orders, right? The wave function itself is indeed a linear combination of (approximated) atomic functions. Now, how does the Laplacian operator show you electron delocalization? The benzene example shows rather localized bonds…
First part: its bond orders that care about electron density!
Second part: define delocalisation! The Laplacian shows a flux away from the atoms and towards the shared “bonds”. But to define delocalisation, you have to define a reference state with which to compare the delocalisation. You could try a valence bond approach, and compare the full wavefunction with each VB reference state to see how the VB stats mix (delocalize). It is in general the difficulty in defining reference states that means delocalization is difficult to quantify in a unique manner.
Tthe benzene example shows six equal C-C bonds; if that is not delocalised (with respect to eg a VB kekule form) I do not know what is.
Can you define Egon what you might have meant by delocalisation? Where else might eg the C-C bonds have been?
OK, still grasping the interpretation here… 🙂
Your comments are quite informative… what I would have expected was the red parts of the benzene ring bonds to be connected… I was tempted to look at these plots as molecular orbitals, but was clearly wrong there: they reflect changes in electron density… so, the blue and red bits are even connected in the sense I was thinking about. They look so ‘localized’ right now 🙂
Related: earlier today I so a plot in some paper (sorry, lost the link), when I was searching the eBooks from Springer, and this plot visualized the change in shielding for NMR spectra… there you actually ‘see’ the delocalization of the pi bonds of the benzene ring (in the most accurate chemical formulation I can give ;), by the disc above and below the ring system.
I guess I was expecting something like that. BTW, I should have checked the paper what operator they were using to calculate that plot… 🙁
NMR is a magnetic response, and not a measure of electron density per se. What would be interesting, and I will do it shortly, is to evaluate the Laplacian for the π and σ electrons separately tp see how each behaves.
Postscript. I have added the σ/π separated Laplacian isosurfaces for benzene to the main post (its not possible to do this in the comments section).
[…] but for all space. Accordingly, another way therefore of representing the Laplacian ∇2ρ(r) is to plot the function as an isosurface, including both the negative surface (for which |V(r)| > 2G(r)) and the positive surface [for […]
[…] Rzepa Chemistry with a twist « Looking at bonds in a different way: the Laplacian. Non-covalent interactions (NCI): revisiting Pirkle […]
Nice, thanx!
(Now, if only I could do these calculations by some simple script in Bioclipse… 🙂
There are two non commercial programs, TopMod09 or Dgrid 4.5, which calculate the Laplacian as a cube of points. All one then has to do is the generic problem of finding an isosurface from a cube of points. But for any reasonable sized molecule, the Laplacian can be time consuming; hours sometimes.
[…] even for a single bond. The Laplacian ∇2ρ(r) at each of these points is +0.29, which is in what Hiberty and Shaik have called the charge-shift category (i.e. NOT a covalent bond). The Laplacian isosurface is shown […]
[…] gradient and taking the band of values appropriate for non-covalent densities. By inspecting the Laplacian of these densities at any point in space, the region can be characterised as attractive, repulsive […]