In this exercise you will perform calculations of properties by exploiting the wavefunction of an MgO crystal obtained in the previous exercise.
A prerequisite for calculating properties is to analyse a wavefunction,
otherwise the properties items are grayed out.
Calculate->CRYSTAL->Analyse Current Wavefunction
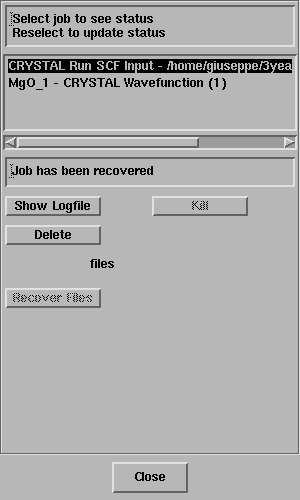
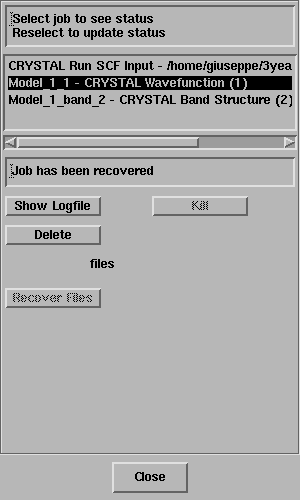
The Job List panel will open automatically and look something like this;
Select the job and the status line should
report "Job has completed" - like this;
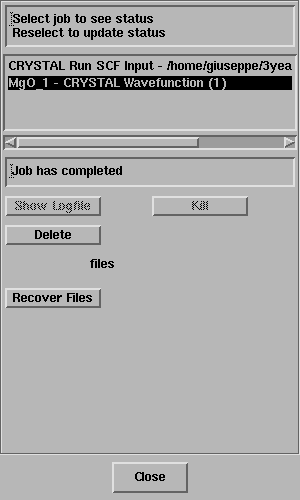
Click on Recover Files.
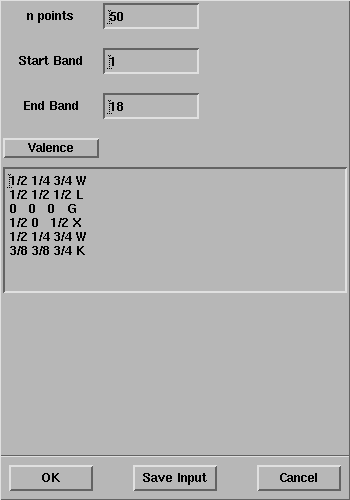
Select Calculate -> CRYSTAL -> Properties -> Band Structure.
The CRYSTAL Band Structure panel will open:
Select OK and the properties calculation will start as evident from the Job List panel
Exercise 2: Repeat the previous exercise,
and press Valence in the CRYSTAL Band Structure panel.

Does the Start Band change with respect to the previous exercise?
Does the End Band change too?
Why? How many electrons are there in a MgO primitive cell?
How many valence electrons? How many core electrons? How many are the bands
occupied by the core electrons?
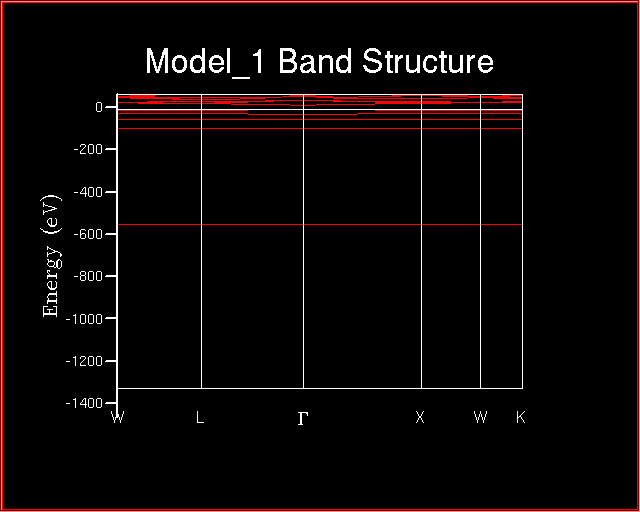
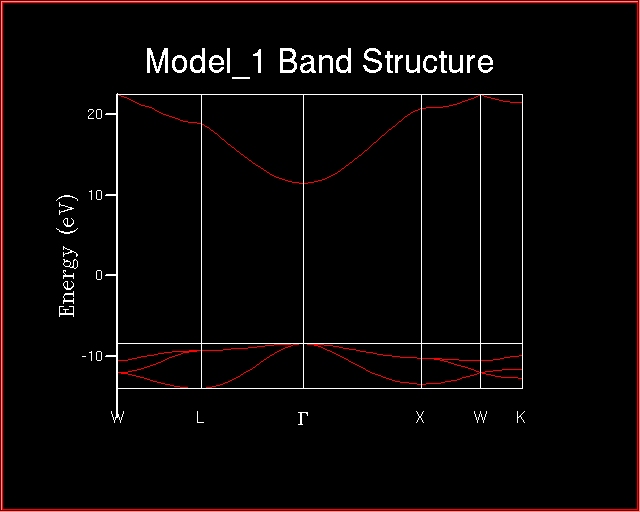
At the end of the calculation, the Band Structure looks like:
When comparing the two plot of the Densities of States, many changes are
evident. The most significant is related to the energy range.
What conclusions can be drawn about the valence and the core levels?
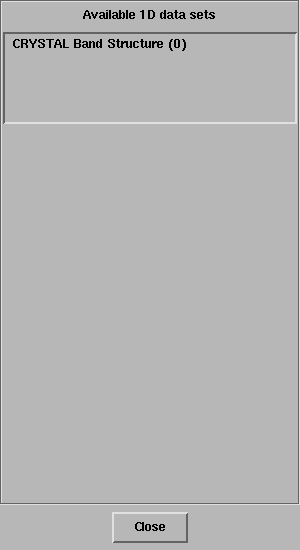
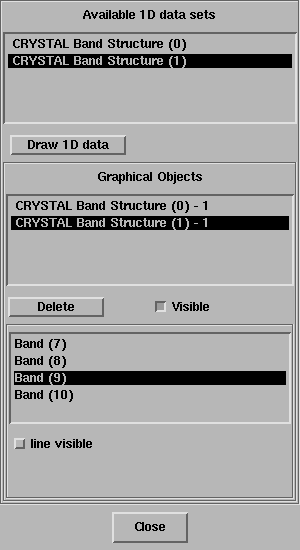
In the 1D Data Display, select each band and turn off the option
Line visible.
Are there degenerate bands?
Exercise 3: Calculate the band gap of MgO?
In insulators and semiconductors, the band gap is the energy difference
between the top of the valence band and the bottom of the conduction band.
Select Calculate -> CRYSTAL -> Properties -> Band Structure.
In the CRYSTAL Band Structure panel,
set the Start Band and the End Band equal to 8 and 11,
respectively.

Why the End Band must be equal to 11 in order to compute the bandgap?
Is the 11th band occupied or virtual?
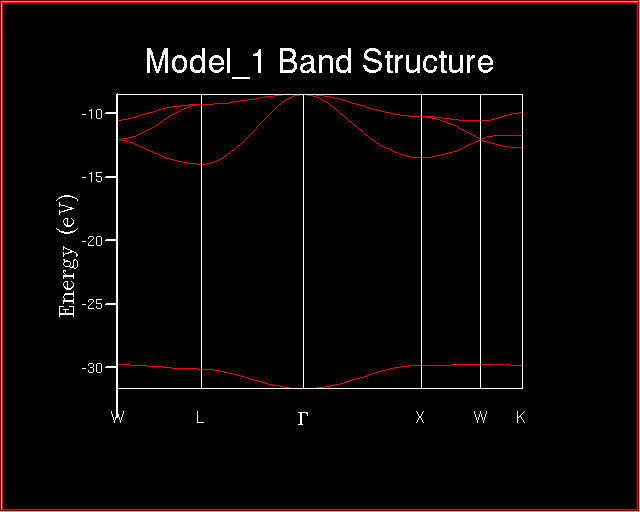
At the end of the calculation, the Band Structure looks like:
Compare the calculated band gap with the experimental value.
Is the band gap direct or indirect?