My momentum of describing early attempts to use optical rotation to correlate absolute configuration of small molecules such as glyceraldehyde and lactic acid with their optical rotations has carried me to L-Malic acid (below labelled as (S)-Malic acid).

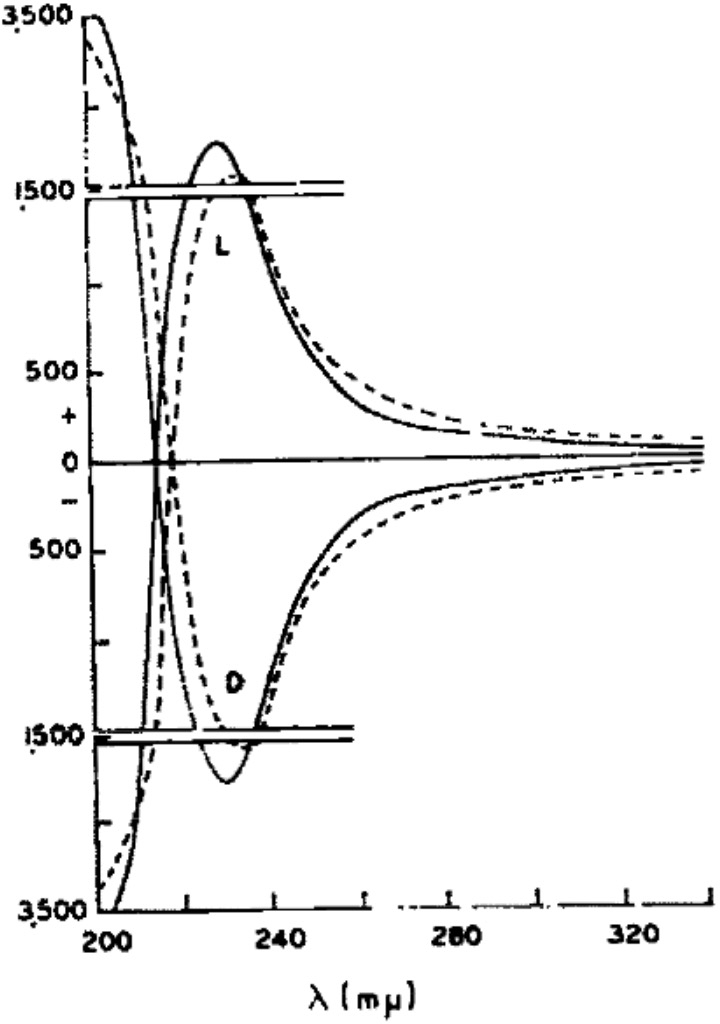
The measured optical rotatory dispersion curve at low wavelengths is shown below (dashed line for Malic acid, solid line for Lactic acid). A sign inversion occurs <220nm to negative rotations. [1]‡ I decided to explore how modern theory of both conformational analysis and chiroptical calculation performs for this small molecule at these wavelengths.
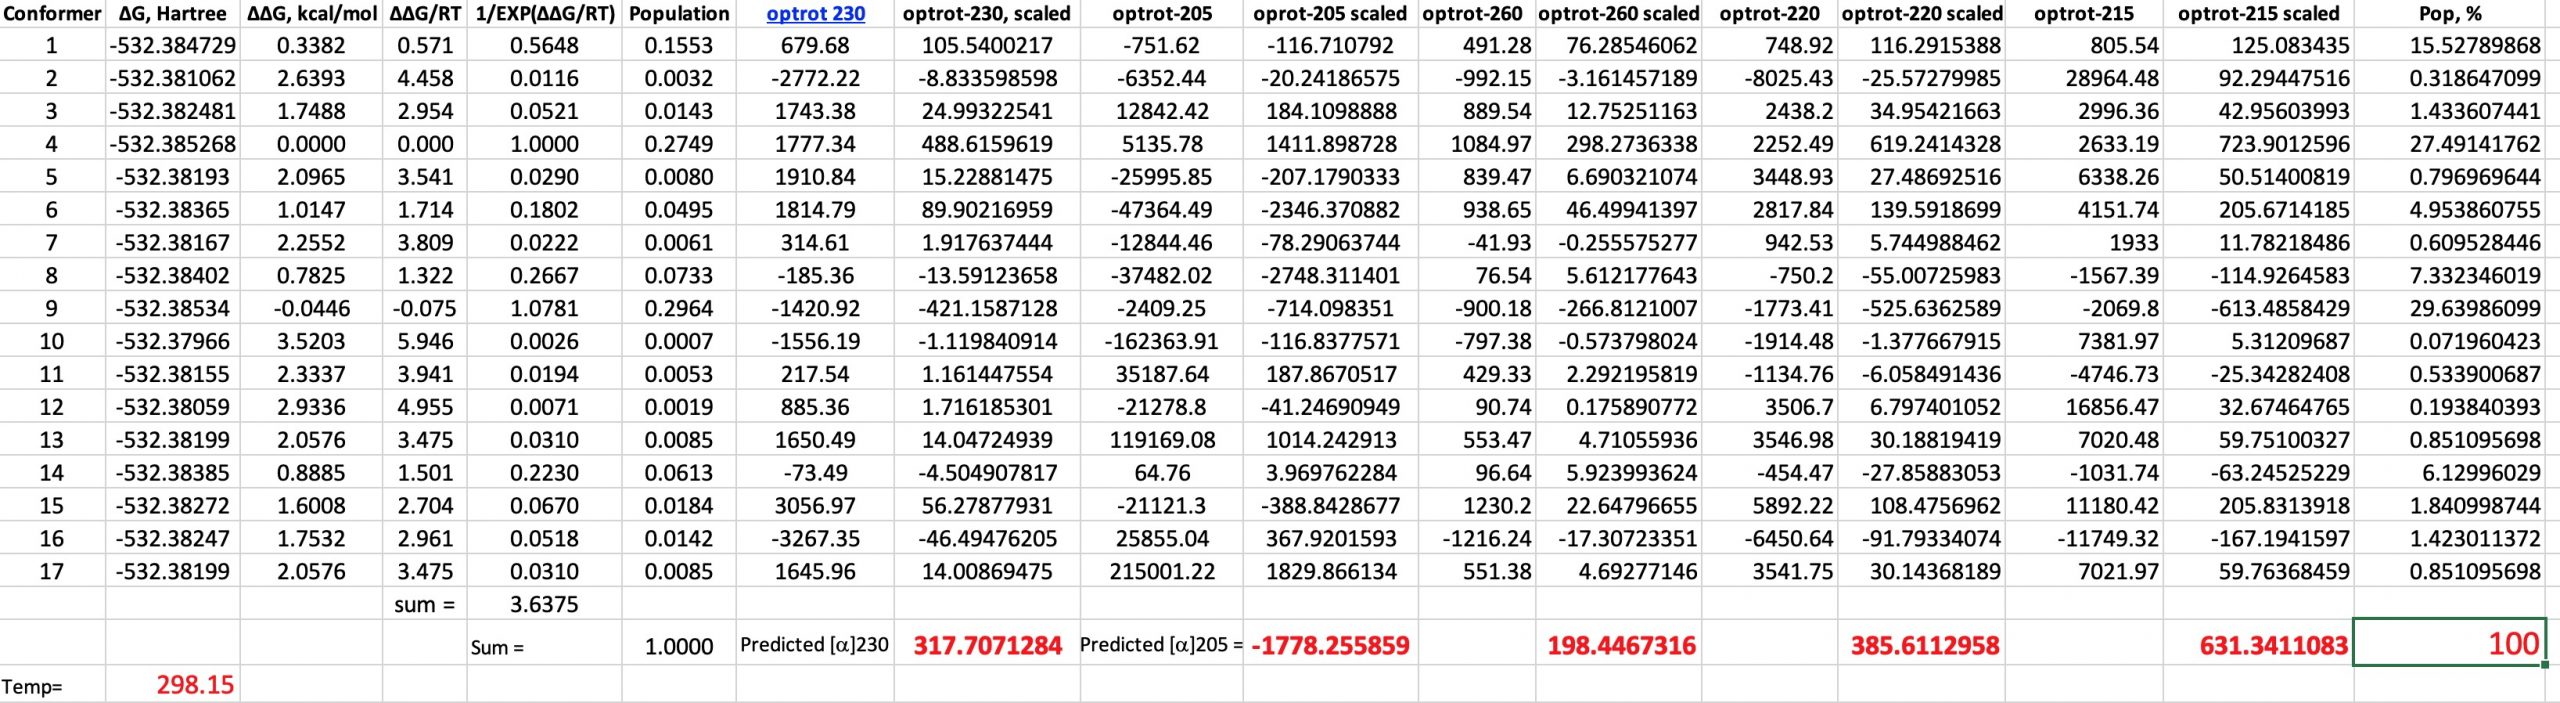
You need good tools to investigate the conformational space of even a small molecule such as malic acid. I used Gaussview 6 with the GMMX plugin.† This identifies rotatable bonds and uses molecular mechanics to optimise all unique conformations which are located up to 3.5 kcal/mol above the lowest energy one. Using this procedure for malic acid produces 17 conformations! The geometry of each was then re-optimised at the following level: B3LYP+GD3BJ dispersion correction, Def2-TZVPP basis and using a superfinegrid pruned to 175,974 for first-row atoms (the default grid is 99,590 in the Gaussian 16 program) to avoid any significant incurrence of rotational dependence of the computed energy. Extra tight convergence criteria for the SCF and 2-electron integrals (12 and 14 respectively in the Gaussian definition) were also selected. A solvent correction for ethanol was also included and the free energy calculated.♥ Once the geometries were obtained, the optical rotations were calculated using ωB97XF/Def2-TZVPP/SCRF=ethanol (DOI: 110.14469/hpc/6510) and the results inserted into a spreadsheet (which is available for you to inspect for yourself).
To summarise.
| Wavelength | ~Observed rotation, ° | Calculated rotation, ° |
|---|---|---|
| 260 | +250 | +194 |
| 230 | +1500 | +318 |
| 220 | +900 | +385 |
| 215 | +400 | +631 |
| 205 | -2660 | -1778 |
- One first notes that 9 of the conformers have a population >1% and the maximum population of any single conformer is ~30%.
- Secondly, the ORD curve in the region 200-230 is extremely steep, so even tiny changes in the wavelength can induce large changes in the optical rotation. This propagates onto the calculations, where the accuracy of the predicted λmax is only about 20nm at this level of theory. This means that the maxima and minima in the experimental ORD curve are likely to be displaced with respect to the calculated curve by perhaps 20nm.
- Next, I note the enormous variation in rotation amongst the conformers themselves. Thus at 215nm, the conformer with the largest +ve rotation has the value +28964°, and the largest -ve is -11749°, with the final value weighted by the Boltzmann populations being much smaller at 631°. This means you are weighting very large positive and negative numbers to produce a much smaller sum. Clearly even small errors in calculating the Boltzmann population could have a big impact upon the final total rotation.
Given all these errors, and the observation that I have not plotted a complete range of wavelengths in order to determine the maximum and minimum values in the ORD curve, the final agreement with experiment is actually not that bad! Perhaps however it is easy to see why ORD is rarely used nowadays to assign absolute configuration using computations, given this combination of interacting errors. Perhaps the greatest value in performing these calculations is actually to give some sense of a reality check on the computed conformational analysis itself, with its calculated Boltzmann populations!
‡This also confirms that the rotation of L-Lactic acid is positive (+) for wavelengths down to 220nm, below which the sign also inverts to a negative rotation. Kuhn’s assertion of absolute configuration of lactic acid is nonetheless proven correct, although he only had access to the much less useful value of the rotation at 589nm.[2] †The free Avogadro program can also perform this task.♥The calculations also include the VCD or vibrational circular dichroism responses for each conformation. I have thus far avoided the task of applying the Boltzmann populations to the VCD spectra for 1cm-1 increments to reveal the expected spectrum.
Author
References
- J. Cymerman Craig, and S. Roy, "Optical rotatory dispersion and absolute configuration—IV", Tetrahedron, vol. 21, pp. 1847-1853, 1965. https://doi.org/10.1016/s0040-4020(01)98655-7
- W. Kuhn, "Absolute Konfiguration der Milchsäure.", Zeitschrift für Physikalische Chemie, vol. 31B, pp. 23-57, 1936. https://doi.org/10.1515/zpch-1936-3105