Solvolytic mechanisms are amongst the oldest studied, but reproducing their characteristics using computational methods has been a challenging business. This post was inspired by reading Steve Bachrach’s post, itself alluding to this aspect in the title “Computationally handling ion pairs”. It references this recent article on the topic[1] in which the point is made that reproducing the features of both contact and solvent-separated ion pairs needs a model comprising discrete solvent molecules (in this case four dichloromethane units) along with a continuum model.
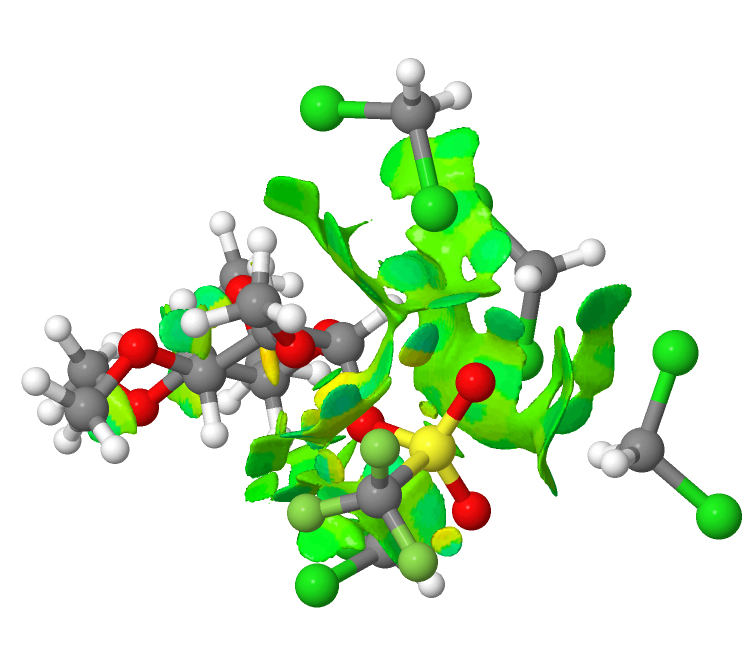
The system is a methylated glucose with a triflate in the anomeric position, and the reaction is the ionisation of the triflate to form an oxenium cation and a triflate anion, this occurring in dichloromethane as solvent. The resulting ion pair can only be modelled if around four explicit solvent molecules are included in the model. The normal wisdom is that explicit hydrogen bonds are not replicated by a continuum solvent model. But relatively non-polar molecules such as dichloromethane are not normally thought of as strong hydrogen bond donors or acceptors. I thought I would take the geometries of the initial covalently bound triflate and the solvent-separated species as reported [1] and subject both to a non-covalent-interaction analysis (NCI). This analyses the electron density in the molecule, and converts a property of the second derivatives of that density into a colour-code surface. Here, blue emerges mostly for hydrogen bonds, whereas weaker interactions such as dispersion attraction emerge as green. The first such diagram relates to covalently bound triflate.

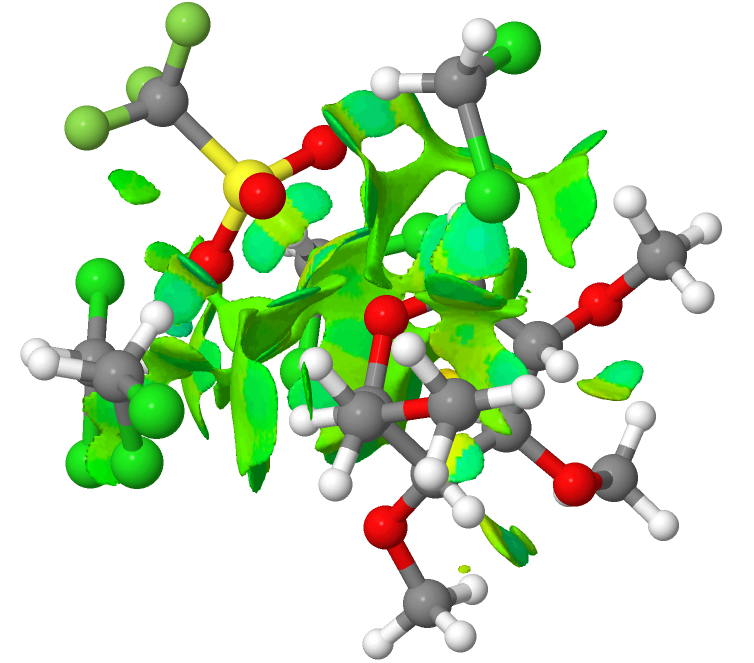
You can see from this that most of the NCI features are coded green; it is a typical dispersion map. Next, the solvent-separated ion-pair. There is a lot more (pale) blue. This indicates that explicit (albeit weak; strong H-bonds emerge as dark blue) hydrogen bond interactions are indeed set up. This in turn might explain why a simple continuum model does not properly account for this species.

Because these are rather globular molecules, with the NCI features distributed internally, it is important that one views these interactively and not simply from one perspective in a static diagram. So do take the opportunity to click on the two images above to load such rotatable views. And then you can explore for yourself exactly where those blue regions occur, and whether you would have classified them as hydrogen bonds without the benefit of the NCI visualisation helping you! The lesson is that a zwitterionic molecule strongly polarises and hence strengthens any weak hydrogen bonds present, meaning they can no longer be dismissed.
References
- T. Hosoya, T. Takano, P. Kosma, and T. Rosenau, "Theoretical Foundation for the Presence of Oxacarbenium Ions in Chemical Glycoside Synthesis", The Journal of Organic Chemistry, vol. 79, pp. 7889-7894, 2014. https://doi.org/10.1021/jo501012s
Tags: 10.1021, Steve Bachrach