Proceedings of the First Electronic Computational
Chemistry Conference, 1994.
Solvation Difference Maps as Probes of Intramolecular Hydrogen Bonding: An
Application of Hyperactive Molecules
Henry S. Rzepa*,
Christopher Leach and
Omer Casher
Department of Chemistry, Imperial College, London, SW7 2AY.
Summary
Experimental data for the equilibrium between the di-axial (1, X = OH) and
di-equatorial (2, X = OH) conformations of cis 3-X-cyclohexanol in a variety
of solvents is compared with quantitative SCF-MO level AM1 and PM3 COSMO solvation calculations.
An analysis using
2D solvation energy contour maps, in which the effect of changing
solvent dielectric is represented as a time-dependent animation of the 2D map,
reveals geometrical regions associated with intramolecular hydrogen bonds
which show up as prominent ridges. Geometries
associated with features in these maps are presented to the user as "hyperactive
molecules" via the World-Wide-Web mechanism. These are invoked by
defining clickable regions
within the 2D maps and hyperlinking these to molecular coordinates in
MOPAC format using chemical MIME types. Results for cis 3-X-cyclohexanol (X=
ethyne, Ph) are analysed for evidence of pi-facial hydrogen
bonding interactions.
Introduction
Abraham et al
[1]
have recently provided accurate Gibb's
free energy changes for the equilibrium between di-axial (1, X= OH)
and di-equatorial (2, X = OH) conformations of cyclohexan-1-X, 3-ol in
fourteen solvents using NMR techniques. In non-polar solvents, the two
conformations are approximately equally populated, but as the solvent polarity
increases, 2 becomes increasingly favoured. This was interpreted as
indicating that the stabilisation of 1 via intramolecular
hydrogen bonding is removed in the more polar solvents.
This is supported by a theoretical study[2] of intramolecular
hydrogen
bonding in systems such as glucose and 1,2-ethanediol, from which Cramer and Truhlar
concluded that
intramolecularly hydrogen bonded conformers remain as the global minima upon
aqueous solvation, albeit by less energy than prior to solvation.
The recent introduction by Klamt[3] of the COSMO solvation algorithm into semi-empirical SCF-MO hamiltonians
such as PM3 allows calculation of the dielectric screening energy
component via an
atom centred distributed multipole analysis in a cavity defined by a realistic
solvent accessible surface. This method allows molecular conformational
analyses to be performed in which all molecular geometries are fully optimised
over a range of values of the dielectric constant of the surrounding medium.
Hitherto, approximations involving cavities of assumed spherical or ellipsoidal
dimensions have inhibited meaningful comparisons between molecules where
substantial changes in geometry occur, and it has not been possible
to vary the permittivity of the medium continuously. We have previously shown[4] that the combined AM1 or PM3/COSMO approach
successfully models the energetics of isomeric systems which differ only in the
presence of a single covalent bond. We considered cyclohexane-1,3-diol as an
ideal system to evaluate the performance of the COSMO method specifically,
for systems differing only in a weaker hydrogen bond.
This system also forces consideration of how the computational data might be
presented. Two problems have to be addressed. Firstly, whilst the
conformational energies can be visualised as 2D energy maps, we felt that the
most important aspect was how to illustrate these change with solvent polarity.
Secondly, we felt it important to annotate the 2D maps with representations of
the molecular geometries in various regions of interest without losing the
clarity of the presentation. We show in this paper how both these aspects have
been solved by employing a combination of animating the 2D map into the form of
an MPEG movie, and associating regions of the 2D maps with molecular
coordinates using chemical MIME types[5] and
presentation using the World-Wide-Web.[6]
Computational Details
Theoretical calculations were carried out using the AM1 and PM3
semi-empirical self-consistent field molecular orbital methods, as implemented
in the program MOPAC 93. The solvation model that was used was the COSMO
Hamiltonian[3], with energies calculated as enthalpies.
No attempt was made to
convert these to free energies because the many low frequency modes associated
with these molecules render inappropriate the rigid-rotor-harmonic-oscillator
approximation used to convert normal frequencies to entropies. Other
corrections related to the free energy of cavitation and dispersion terms
[2] are not available in the current version of COSMO. The
extensive subtraction of similar quantities in the solvation difference
maps could be expected to minimise the effects of these approximations.
The keywords
PRECISE, EF, RMIN=-100, GNORM=0.5 and GEO-OK were used for maximum accuracy.
To produce the two
dimensional grids, the dihedral angles of the hydroxyl O-H bonds relative to
the cyclohexane ring were changed in steps of 18° to give a
square grid of dimension 20. The COSMO algorithm was invoked using the keyword
EPS=solvent dielectric. The 2D grids were produced and normalised to unity by
subtraction of each cell from the corresponding values for EPS=1 (gas phase),
thus leaving only features associated with changing solvent polarity visible.
These solvent-difference grids were visualised in Microsoft Excel v5.0 and
converted to a series of bitmapped images, one for each value of the solvent
polarity. A sequence of these images were converted to animation format using
QuickTime compression and to MPEG format for presentation using the
World-Wide-Web as a delivery mechanism. Minimum energy conformations were
obtained from the 2D grids, and re-optimised fully.
Results and Discussion.
The calculated enthalpies of formation for 1 and 2 for various
substituents X are shown in the Table. For the diol (X=OH), the AM1 calculations
indicate that the di-axial systems is 5.5 kJ mol-1 less stable than
the di-equatorial form. This accords with the well known observation that
the strength of OH...O interactions can be underestimated by this method.
This difference is increased to 12 kJ mol-1 when the
solvent dielectric is increased to 80, which accords well with the experimental
observation that the di-equatorial form predominates in more polar solvents.
Put simply, the di-equatorial form benefits from the full solvation of both
hydroxyl groups, whereas the di-axial form loses the equivalent of one hydrogen
bond to stabilisation by the solvent.
That this effect is directly due to the loss of the intramolecular hydrogen
bond can be illustrated as follows. Figure 1 shows a full conformational
energy map calculated at the AM1 level
for 1 (X=OH) as a function of the rotational dihedral
angle of the two OH groups. The circled regions indicate available molecular
co-ordinates when viewed with a suitable viewing package.
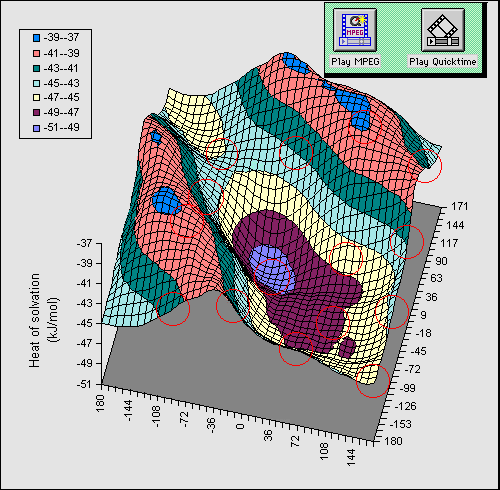
In order to simplify the diagram, we have
calculated a difference map in which the energy at each point in the grid for a
dielectric constant of 1 is subtracted from that calculated at a value of the
dielectric of 80. Thus the map reveals the solvation energy as a result of the
conformational orientation of the two OH groups. The low energy regions
corresponding to greatest solvation energy are those where no intramolecular
hydrogen bond is present, whilst the ridges seen in the isometric projection
are precisely those associated with such a hydrogen bond. The ridge like
features are obviously absent for the gas phase, and only become prominent as
the calculated dielectric is increased from 1.
Further information about this phenomenon can be delivered by two "multimedia"
techniques. Firstly, an animation of the solvation map as a function of varying
solvent dielectric can be made to reveal the growth of the "hydrogen bond
ridge". Using the metaphor of the World-Wide Web, the animation files in
Quicktime (diequatorial, diaxial) or MPEG (diequatorial, diaxial) format can be delivered to the user via "hot-spots" or
hyperlinks built into the actual isometric map and shown as buttons in the top
right of the diagram. Secondly, molecular coordinates can be associated with
chemical MIME types[5]such that when a particular region of the
solvation map is activated, the coordinates are transferred to the user's
computer and visualised using a suitable visualisation program. Thus the reader
can themselves verify that the ridges actually correspond to geometries
containing an intramolecular hydrogen bond. Furthermore, since the optimised
molecular coordinates are now available to them, they can also verify the
energies we report in the Table as being accurate and reproducible.
In Figure 2, the same series of calculations are presented for the
di-equatorial system 2. Because no intramolecular hydrogen bond can be
disrupted in this system, the entire map is virtually featureless, and no
discernible ridges can be seen.
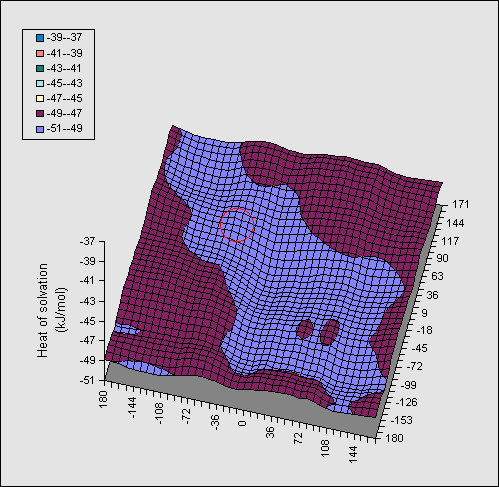
Table. Calculated AM1 (PM3) enthalpies (kJ
mol-1) for 3-substituted di-axial and di-equatorial
Cyclohexanols
| System | Dielectric=1 | Dielectric=80 |
| 2, X = OH | -540.1(-480.2) | -589.6(-522.9) |
| 1, X = OH | -534.6(-475.7) | -577.6(-514.6) |
| 2, X = ethyne | -110.3( -77.6) | -144.8(-106.4) |
| 1, X = ethyne | -102.2( -73.6) | -131.1( -98.0) |
| 2, X = Ph | -230.4(-186.8) | -268.5(-216.9) |
| 1, X = Ph | -214.2(-179.1) | -249.4(-206.8) |
| 2, X = p-NO2-Ph | -217.3(-224.8) | -296.1(-334.9) |
| 1, X = p-NO2-Ph | -200.3(-216.2) | -277.0(-324.0) |
| 2, X = p-MeO-Ph | -388.9(-345.8) | -440.1(-385.3) |
| 1, X = p-MeO-Ph | -372.6(-337.9) | -420.9(-375.0) |
We have recently discussed[7] crystallographic
evidence that alkyne and aromatic groups can participate in significantly short
hydrogen bond interactions. Unfortunately, crystal structures give no
indication of the energetics of such interactions. Following the approach of
Abraham et al[1] a system such as (1, X=ethyne)
may provide one means of estimating the strength of such interactions
experimentally. Whilst experimental studies are under way, we set the scene by
modelling these systems (Table). At the AM1 level,
the di-axial system was calculated to be 8.1
kJ mol-1 less stable than the di-equatorial in the gas phase, a
value quite similar to the diol, and which increased to 13.7 kJ
mol-1 at a dielectric of 80. These values are very similar to the
basic diol system, which suggests that experimental studies should yield
similar results for the alkyne system. Hydrogen bonding to phenyl groups is
similarly well established[7] and in this system we also have the
opportunity for structure-activity studies by varying the ring substitution.[8]
A solvation energy map (1, X=Ph, Figure 3) constructed along similar lines
to the diol, in which the rotation angle of both the OH and the phenyl ring are
varied, resulted in similar but less promiment ridges to those observed for the diol.
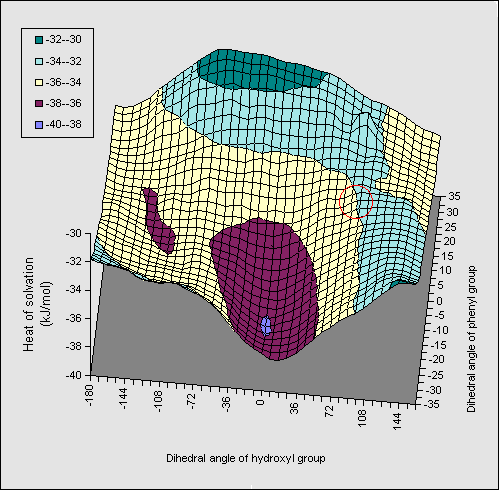
The orientation involving direct OH...pi bonding is
hyperlinked to coordinates so that readers can inspect the geometry for
themselves. The AM1 energetics (Table) show that the di-axial conformation is
intrinsically less stable than the di-equatorial form, compared to the diol
system (16.2 kJ mol-1). Solvation again increases this energy
difference, but by less than the diol. The effect of substituents was
negligible, suggesting they should have no perceptible effect on the
axial/equatorial ratios. Experimental results relating to these predictions
will be reported elsewhere.
We conclude that the COSMO solvation algorithm allows
energy maps to be constructed with inclusion of complete geometry optimisation,
and represents a significant
advance in the ability to model the conformational properties of molecules in solution. The
use of animations, hyperlinked 2D diagrams and the delivery of molecular
coordinates in the form of hyperactive molecules serves to simplify diagrams,
whilst adding value for the reader by providing them with working models. We
believe that such forms of scientific publication can only serve to enhance the
quality of reported scientific data.
References
[1]R. J. Abraham, E. J. Chambers and W.
A. Thomas, J. Chem. Soc, Perkin Trans. 2, 1993, 1061.
[2]C. J. Cramer and D. Truhlar, J. Am. Chem. Soc., 1993, 115,
5745, ibid, 1994, 116, 3892.
[3] A. Klamt and G. Schürmann, J. Chem. Soc., Perkin
Trans. 2, 1993, 799.
[4] H. S. Rzepa and G. Suner, J. Chem. Soc., Perkin Trans 2,
1994, 1397. See http://www.ch.ic.ac.uk/rzepa/RSC/P2/4_02709D.html
[5] O. Casher, G. Chandramohan, M. Hargreaves, C. Leach, P. Murray-Rust, R.
Sayle, H. S. Rzepa, B. J. Whitaker, J. Chem. Soc., Perkin Trans. 2,
1995, 7. See http://www.ch.ic.ac.uk/rzepa/RSC/P2/4_05970K.html
[6] H. S. Rzepa, B. J. Whitaker and M. J. Winter, J. Chem. Soc.,
Chem. Commun, 1994, 1907. See http://www.ch.ic.ac.uk/rzepa/RSC/CC/4_02963A.html
[7] H. S. Rzepa, M. H. Smith and M. L. Webb, J. Chem. Soc., Perkin Trans 2,
1994, 703. See http://www.ch.ic.ac.uk/rzepa/RSC/P2/3_05613l.html
[8] Further details will be reported in C. Leach and H. S. Rzepa, J. Chem. Soc., Perkin Trans. 2, to be submitted.