- Computational procedure: B3LYP density functional, with the following basis sets: SDD Pseudopotential on Sn, 6-31G(d) on ligand, STO-3G on bulky alkyl groups.
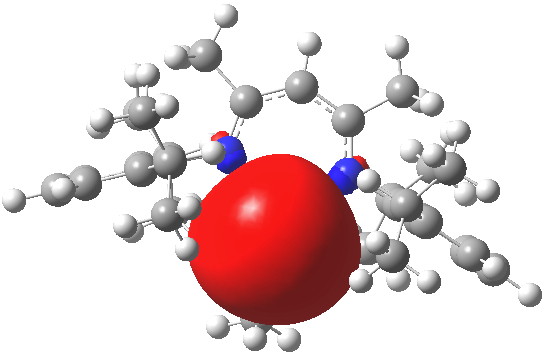
- The initiator for cycle 1 reveals the hemi-directed void, in part protected by three methyl groups. The Sn-OMe bond is directed axial with respect to the ligand. An NBO analysis shows that the Sn 5s orbital can be localised almost exactly into the coordination "void"
- Approach of a lactide unit via the carbonyl group is within the coordination hemisphere, but clearly the incipient Sn-O=C bond is currently equatorial. It will eventually become bonded to the Sn, and will need to itself become axially oriented via a pseudorotation at the Sn center.
- This is achieved during the approach to TS1 at which both oxygen atoms are now covalently bonded to Sn, but the lactide Sn-O=C bond has now become axial.
- The normal reaction mode has a wavenumber of 115 cm-1 and corresponds in form to a [2+2] addition of the Sn-O and C=O bonds, via nucleophilic attack by the alkoxy oxygen on the carbon of the carbonyl group (RO-C 2.064Å).
- The product of this cycloaddition is TI1 which rearranges conformationally to TI2 such that the existing Sn-O bond can be cleaved and a new one formed
- This process happens in TS2. At this transition state, the new Sn-O bond is formed, with concomitant O-C and Sn-O cleavage in a retro [2+2] cycloelimination (wavenumber 112 cm-1).
- TS2 appears to be stabilised by weak interactions between methyl groups and aryl rings.
- In this first cycle of polymerisation, TS1 is clearly higher in free energy than TS2 by 5.6 kcal/mol. ΔG‡ from initiator+lactide is 29.4 kcal/mol.
- The product of this first step, which is exothermic in free energy by -5.8 kcal/mol with respect to reactants, itself becomes the reactant of the second polymerisation step.
- The second cycle of polymerisation proceeds similarly to the first, but with some significant differences which are highlighted here. The initial reactant contains an additional C=O...Sn intramolecular interaction which the original initiator did not have access to. This interaction survives up to the first transition state TS1 (2.56Å). The effect is to "soften" the bond forming reaction mode (RO-C 2.253Å) the wavenumber of which now drops to 80 cm-1 from 115. The additional C=O...Sn starts to weaken at TI1 (RO-C 2.754Å) and has gone by TI2 (RO-C 3.94Å)
- The consequence is that TS2 has RO-C 2.262Å virtually the same as with the first cycle (RO-C 2.263Å) and an unchanged νi=114 cm-1.
- The effect of all this is to stabilize TS1 with respect to TS2 during cycle 2, making the two transition states essentially isoenergetic in free energy to within 0.2 kcal/mol. The hemi-directed void in the original Sn coordination sphere does not allow TS1 in cycle 1 to be stabilized by initial solvent-Sn interactions, whilst TS1 in cycle 2 is intramolecularly stabilized by the extruding polymer chain.
- The overall second step is slightly endothermic in free energy with respect to its reactant (by +1.5 kcal/mol). It might be possible that the extruding polymer chain is slightly constrained in its entropy by weak interaction with the face of an aryl group. We speculate that cycle 3 and further polymerization steps would be free of this constraint, increasing their entropy and hence reducing the free energy of subsequent cycles.
| Cycle 2 Total energies (Hartree) Cycle 1 Total Energies in red [Corrected for ΔG298 (Hartree)] {IEFPCM solvation by THF} |
|
|---|---|
|
|
|
| -1880.97974[-1880.19977] {-1880.93162} + -534.35128[-534.24493] {-534.35364} = -2415.33102[-2414.44470] {-2415.28526} -1346.59586[-1345.94552] {-1346.55343} + -534.35128[-534.24493] = -1880.94714[-1880.19045] {-1880.90707} |
-2415.34841 [2414.44290] {-2415.29604} -1880.96089 [-1880.18486] {-1880.916335} |
|
|
|
| -2415.33236 [-2414.41614] -1880.97210 [-1880.18803] |
-2415.33940 [-2414.42309] -1880.96808 [-1880.18111]: |
|
|
|
| -2415.30817 [-2414.39437] {-2415.25912} -1880.92450 [-1880.14353/29.5] {-1880.88354} |
-2415.30548 [-2414.39399/31.8] {-2415.26083} -1880.93761 [-1880.15246] {-1880.90123}: |
|
|
|
| RRSS-Sn Product | |
| -2415.35371 [-2414.44232] {-2415.29976} -1880.97974 [-1880.19977] {-1880.93162} |
|
- Two (independent) corrections to the potential energies are made; vibrational corrections (ZPE, entropy) and continuum solvation. To some extent these overlap, since the solvation correction includes free energies of solvent cavitation, which may partially compensate for the loss of translational/rotational degrees of freedom in bringing two reactant cavities to form one transition state cavity. With this caveat in mind, the following barriers are obtained:
- Step 1: Pre-reactant + lactide => TS1, ΔGgas 29.4
- Step 1: Pre-reactant + lactide => TS1, ΔGsolv 14.8 + entropy correction
- Step 1: Pre-reactant.lactide complex => TS1, ΔGgas 25.9
- Step 1: Pre-reactant.lactide complex => TS1, ΔGsolv 20.6 (smaller entropy correction since this reaction is balanced)
- Step 2: Pre-reactant + lactide => TS1, ΔGgas 31.6
- Step 2: Pre-reactant + lactide => TS1, ΔGsolv 16.4 + entropy correction
- Step 2: Pre-reactant.lactide complex => TS1, ΔGgas 30.5
- Step 2: Pre-reactant.lactide complex => TS1, ΔGsolv 23.2
- Step 2: Pre-reactant.lactide complex => Product, ΔGgas +1.5
- Step 2: Pre-reactant.lactide complex => Product, ΔGsolv -9.1 + entropy correction
- Although combining these effects must be considered an approximation, one can conclude from 3/4, 7/8 that solvation lowers the barrier for TS1 by between 5-7 kcal/mol. Applying this to 1/2, 5/6 implies the entropy factor that must be added to the solvation correction is about 10 kcal/mol.