Physical Properties

  NMR Data           IR Spectrum

General Physical Data
 

Molecular Weight

653.70
Molecular Formula
C25H43N13O8
CAS Registry number
61394-77-2
Beilstein Registry number
876587
Chemical Name
L-3,6-diamino-hexanoyl->-cyclo-[L-2,3-diamino-propionyl->-L-seryl->-L-alanyl->-2-amino-3-ureido
-acryloyl->-(S)-amino-((R)-2-amino-1(3),4,5,6-tetrahydro-pyrimidin-4-yl)-acetyl-(1->N%3&)]
Auto name
3,6-diamino-hexanoic acid [12-hydroxymethyl-3-(2-imino-hexahydro-pyrimidin-4-yl)-9-methyl-
2,5,8,11,14-pentaoxo-6-ureidomethylene-1,4,7,10,13-pentaaza-cyclohexadec-15-yl]-amide

 
Cpm IA10
Cpm IB10
Cpm IIA14
Cpm IIB14
m.p. / oC
240-5
250-3
250
252
[a]D / o
-22.0
-42.5
+9.3
-24.9
UV / nm
0.1 M HCl
269 (e 23, 400)
268 (22, 000)
H2O
268 (23, 200)
268 (21, 900)
0.1 M NaOH
288 (15, 800)
290 (13, 100)
According to the literature9the following applies to naturally occuring capreomycin:
Ratio of IA to IB    = 1.16
Capreomycin II      = 1.5%
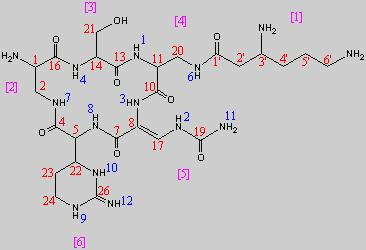
General Data                                                  IR Spectrum


13C NMR Data of Cpm IA
 

Carbon Number
d /  ppm
1
51.92
2
40.28
4
172.76
10
176.29
11
54.15
5, 14
55.66
56.23
7
168.0
8
105.90
13
172.00
16
176.6
17
135.79
19
155.32
20
18.86
21
68.33
22
49.20
23
23.53
24
49.83
26
157.0 (b)
1'
172.0
2'
36.93
3'
49.26
4'
23.59
5'
29.77
6'
39.77
The included NMR data is taken from tables in the literature8, 14The 13C NMR data is that of Capreomycin IA only, and the carbons are numbered accordingly in red on the structure shown above.

Below are 1H NMR tables for the four different naturally occurring forms of capreomycin, the NH protons and CH protons are given in different tables. The NH protons are again numbered on the Cpm IA structure above, but this time in blue. The CH protons are numbered according to their postion in the amino acid residue. These are also numbered in pink on the above diagram. A more detailed diagram of the positions of the amino acid residue is shown on the synthesis page For the exact structures of the other capreomycin forms, please refer to the structure page.


Chemical Shifts of CH protons in Capreomycin Analogues
 
Position of Amino Acid Residue

Cpm IA

Cpm IB
Cpm IIA
Cpm IIB
1
a-CH2
2.63 (dd)
2.5 (dd)
2.85 (dd)
2.81 (dd)
b-CH2
3.8 (m)
3.7 (m)
g-CH2
1.8 (m)
1.8 (m)
d-CH2
1.8 (m)
1.8 (m)
e-CH2
3.10 (m)
3.08 (m)
2
a-CH
4.3-3.5 (m)
4.2-4.5 (m)
4.3-4.6 (m)
4.3-4.6 (m)
b-CH2
3.3 (m)
3.3 (m)
3.3 (m)
3.3 (m)
3.8 (m)
3.8 (m)
4.1 (m)
4.1 (m)
3
a-CH
4.86 (t)
4.67 (q)
4.84 (t)
4.68 (q)
b-CH2
3.84 (d)
3.95 (d)
b-CH3
1.43 (d)
1.45 (d)
4
a-CH
4.3-4.5(m)
4.2-4.5 (m)
4.3-4.5 (m)
4.3-4.5 (m)
b-CH2
3.7-4.2 (m)
3.7-4.2 (m)
3.7-4.2 (m)
3.79 (dd)
3.8-4.2 (m)
5
b-CH
8.04 (s)
8.03 (s)
8.05 (s)
8.04 (s)
6
a-CH
5.01 (d)
4.96 (d)
5.01 (d)
4.95 (d)
b-CH
4.5 (m)
4.5 (m)
4.5 (m)
4.5 (m)
g-CH2
1.6-2.3 (m)
1.6-2.3 (m)
1.6-2.3 (m)
1.6-2.3 (m)
d-CH2
3.3 (m)
3.3 (m)
3.3 (m)
3.3 (m)

Chemical Shifts of NH Protons of Capreomycin Analogues
 

Cpm IA
Cpm IB
Cpm IIA
Cpm IIB
1
9.33 (d)
9.72(d)
9.60 (d)
9.50 (d)
2
9.24 (d)
9.24 (d)
9.33 (d)
9.30 (d)
3
8.82 (s)
8.76 (s)
9.10 (s)
9.10 (s)
4
8.64 (d)
8.68(d)
8.73 (d)
8.73 (d)
6
8.22 (t)
8.15 (t)
7
8.10 (t)
8.15 (t)
8.19 (t)
8.08 (t)
8
7.61 (d)
7.62 (d)
7.50 (d)
7.49 (d)
9
7.46 (s)
7.42 (s)
7.44 (s)
7.44 (s)
10
7.46 (s)
7.42 s)
7.31 (s)
7.18 (s)
11
6.48 (s)
6.49 (s)
6.43 (s)
6.34 (s)
12
6.29 (s)
6.34 (s)
6.29 (s)
6.27 (s)

Using the program gNMR I attempted to plot the above data. However, this was not successful as this program can only cope with molecules with up to 23 protons. As this molecule has Capreomycin IA has 43 hydogens, the generated 1H NMR was lacking many essential peaks, and hence was not included.

General Data                          NMR Data

IR Spectrum of Capreomycin IA

This IR spectrum was generated by entering the SMILES string of my molecule into a website19. The same process could have done for any of the other three Capreomycin anlogues. The very broad band around 2000 cm-1 upwards is due to the presence of so many nitrogen and carbonyl groups and hence hydrogen bonding.


General Data              NMR Data              IR Spectrum

Home                                Back to Top