- 4-hydroxy-3-(3-oxo-1-phenyl-butyl)-chromen-2-one
- 3-(2-acetyl-1-phenylethyl)-4-hydroxycoumarin
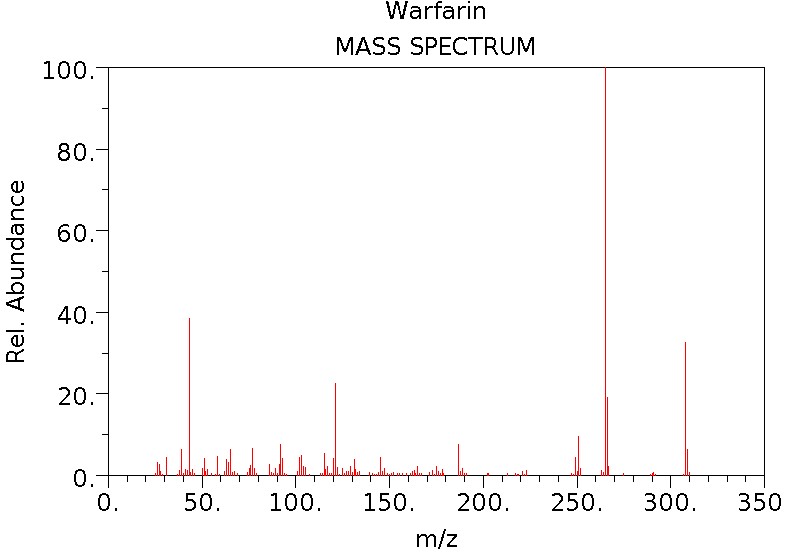
- (+ -)Warfarin
C19H16O4
81-81-2
308.33

Optical Isomers: S-Warfarin and R-Warfarin
161
S-Warfarin : -25.5 ± 1º
R-Warfarin : +24.8 ± 1º
R-Warfarin : +24.8 ± 1º