H-C-C, 0-2 ppm; H-C-C=O, ~2 ppm; H-C-N, ~3 ppm; H-C-O, ~4 ppm; H-C=C, ~5 ppm; H-aromatic, 6-7 ppm; H-C=O, ~9 ppm; H-O-C=O, ~12 ppm (for more extensive tables, see the recommended text).
This information supplements that obtainable from 13C spectra. In this lecture we will focus on the type of information not obtainable from 13C spectra, namely stereochemical information derived from the numerical values of coupling constants and the techniques used to derive this information.
As noted above, the coupling J is a manifestation of the splitting of Bo by the essentially equal populations of the ground and excited energy levels of a spin 1/2 nucleus. As such, it depends not on the absolute value of Bo but on the characteristics of the nuclei involved and in particular of the bonding electrons between them. Chemical shifts on the other hand are directly related to relative Larmor frequencies, and so do depend on Bo. Let us illustrate this with part of the spectrum of trans3-phenyl propenoic acid, which gives rise to a so called two-spin system. The spin system is referred to as AB if the chemical shifts are quite close together, and AX if they are far apart.

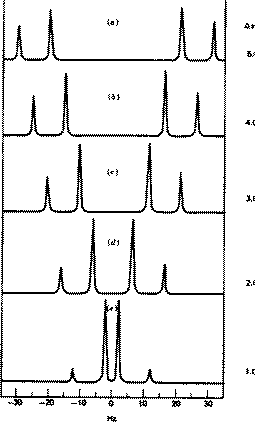
J = d * w/106, which in each spectrum is approximately 16 Hz. Before we discuss the chemical interpretation of this value, we note that a) the 600 MHz spectrum appears simpler than the 60 MHz version and b) the 60 MHz relative peak intensities are dramatically different from those at 600 MHz. As J (in Hz) becomes numerically similar to the difference in Larmor frequencies (in Hz) between the two protons (Dwo = d * waverage/10 6) the spectra are said to become more "second order", the prime manifestation of which is the "tilting" of the intensities of each doublet towards the other. It is actually possible to solve the equations describing this behaviour. You can do this for yourself using a program called gNMR, available on both Macs and PC systems.
Since J coupling depends on the intervening bonds and electrons, its value is highly characteristic of these bonds. In this case the coupling arises from three intervening bonds, and hence we term it 3JH-H coupling. Typical values for alkenes are;

The next spectrum is slightly more complex;
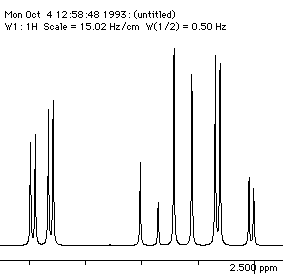
Each proton is described as a double doublet, since the two couplings involved are numerically different. The actual values when measured from the spectrum are; da 2.72, db 3.25, dc 4.38 ppm; Jab = 18 Hz, Jac = 2, Jbc = 10 Hz. To see what the spectrum for this system looks like, you can simulate it using the geNMR program. Instructions will be issued during the lecture course.
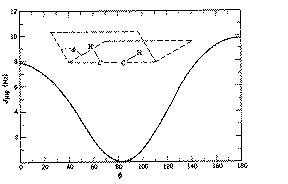
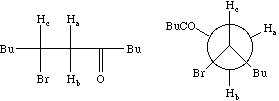
Before we leave this system, we ask why the 2J H-C-H coupling in this compound is visible, whereas that in eg bromoethane is not. If a CH2 group is close to a chiral centre in the molecule, the two methylene protons are said to be diastereotopic and are likely to have differing chemical shifts and different coupling to adjacent protons. This effect arises NOT from any restricted rotation about the C-C single bond, but from the absence of any possible plane of symmetry bisecting the methylene group. As can be seen from the Newman projection above, in all possible conformations for this molecule, Ha and Hb are always in a different environment; this would not be true of eg bromoethane.
Other Types of Coupling.
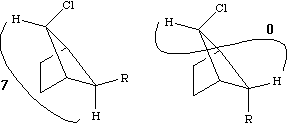
4J for allylic coupling, H-C=C-C-H varies from -3 to +2 Hz, depending again on the angle between the two H-C bonds. In aromatic systems, 3J or ortho coupling ~ 7-8; 4J or meta coupling ~ 2 Hz; 5J or para coupling ~ 0.5 Hz. Large long range coupling is not often observed, but one type of system does reveal a dramatic dependence on geometry, often called "W" coupling because of the relationship betwen the two protons;
Coupling Between Protons and Other Nuclei. We have seen previously how 1H- 13C coupling can help in understanding 13C spectra but such coupling is not apparently observed in 1H (thank goodness) because on average there is only a 1% probability that a given proton will be adjacent to a 13C nucleus. However, if you look about 2JH-C/2 ~ 65 Hz away from a strong proton peak (eg methanol) you may see a small peak about 0.5% of the intensity of the central proton peak. This is the so called carbon satellite arising from just such hetero-nuclear coupling. Observing such satellites can sometimes have uses. Another satellite due to 2J29Si-CH coupling is often observed (but rarely correctly attributed) as a small peak +/-3 Hz of the proton TMS signal and about 2.5% the height. Satellites are commonly observed in spectra of many other elements where the isotopic abundance is not 100%.
Finally if either 19F or 31P are present in a molecule, both are likely to couple to protons since these isotopes are 100% abundant. Typical couplings are 1JH-P ~ 200-700 Hz, 2JHC-P ~ 0.5 - 20 Hz; 2JHC-F ~ 45 Hz, 3JHC-F ~ 5-20 Hz. Heteronuclear spectra can be simulated using the gNMR program.
Simplification of Spectra. The three spin proton system discussed above had 12 lines, but even so the "tilting" and closeness of the peaks frequently results in spectra that are very difficult to interpret. Many modern techniques are available for dealing with this problem. Here we will deal with only a few to give some flavour of how these problems are approached.
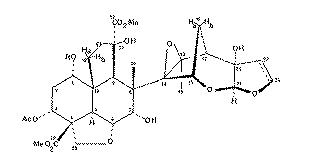
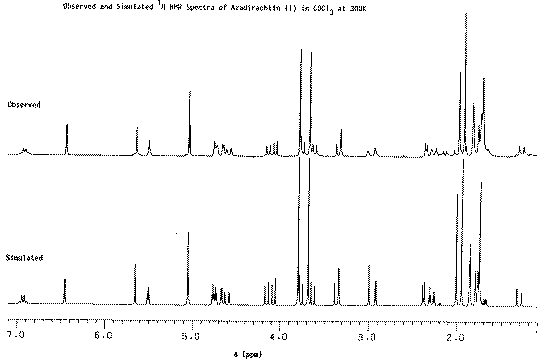
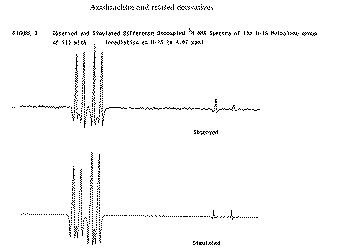
Our second example of decoupling also introduces the concept of a "difference spectrum". If a spectrum is recorded twice, once with the decoupler on and once with it off and the two spectra are subtracted, what remains (in principle) is the effect due to decoupling. The full spectrum of a typically complicated natural product Azadirachtin is almost un-interpretable, even at high field (in this case 250 MHz).
