![]()
![]()
![]()
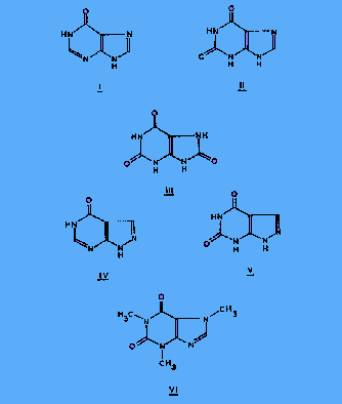
Interesting Test of Allopurinol on Gout Patients
|
||||||
Determination of Volatile Constituents of Human Blood and Tissue Specimens by Quantitative High Resolution Mass Spectrometry
A
technique utilizing multiple peak integrated ion current mass
spectrometry at high resolution has been designed to enable the
simultaneous determination of up to five compounds present in human
blood plasma and muscle tissue. Apart from simple desiccation, no
chemical extraction of the specimen or isolation of the compounds to be
determined is required. The compounds are determined at the 10-100 ppm
level to and accuracy of ±20% with a consumption of only 5 mg of desiccated
material for a duplicate analysis. The method is illustrated by
comparative estimations of purine metabolites in normal and gouty
individuals.
Experimental
Materials.
Specimens
of normal skeletal muscle were obtained from patients undergoing minor
surgical operations. None of these subjects ad suffered previously from
any disease of purine metabolism. Specimens from untreated and
allopurinol-treated gout pout patients were the same as those obtained
earlier for microscopic investigation. Ten-milliliter samples of blood
were withdrawn from healthy volunteers. Each specimen was immediately
transferred to a heparinized container, centrifuged at 4ƒC and the plasma layer separated for investigation.
The specimens were dehydrated and 2-3 mg portions admitted to the mass
spectrometer.
Qualitative
Observations. Before
attempting quantitative measurements, it was necessary to ensure that
the characteristic ions, on which subsequent quantitative analyses if I-
V were based, were completely separated from background
ions of the same nominal mass arising from the fragmentation of other
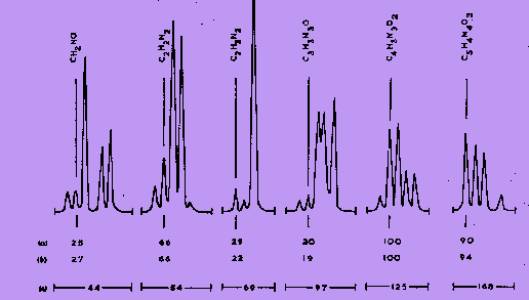
constituents of the specimen. In Figure 1, the relative intensities if
the ions having the correct atomic composition to be derived from uric
acid are compared, at a resolving power of 20,000 (10% valley
definition), with a standard mass spectrum. With the exception of m/e 69
which was not used for quantitative measurements, the agreement was
satisfactory. This indicated further that interference from unresolved
ions of almost the same precise mass but derived from sources other than
uric acid was negligible. Similar conclusions could be drawn about the
characteristic ions of the other four compounds in this study.
Quantitative
Measurements. To
obtain abundance data of high sensitivity, independent of vaporization
temperature and inlet fractionation, for a series of ions from the same
sample, a technique involving multiple peak selection and ion current
integration was devised.
Setting
Up procedure. After
the mass spectrometer resolving power was adjusted to some suitable
value between 15,000 and 20,000, a mixture of the substances to be
determined was admitted. Each channel of the peak selector was then
adjusted to display on the mass spectrometer oscilloscope one of the ion
beams to be measured. The ion accelerating voltage sweep
was then decreased to exclude all multiplet peaks except that of
interest. At a sweep speed of 2cm/sec, this display could be recorded on
a fast response pen recorder.
Measurement
Procedure. After
admission of the sample, the vaporization temperature was raised until
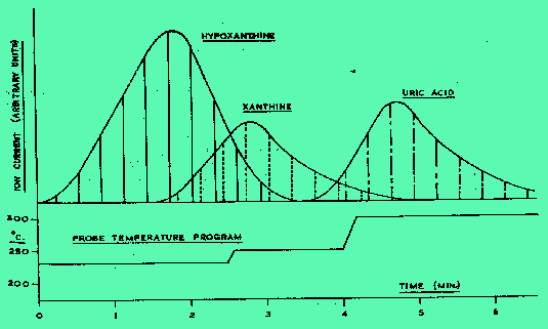
the most volatile component (hypoxanthine at 23ƒC) began to appear. To avoid excessive tailing of the
less volatile uric acid, the vaporization temperature was increased
during the run as shown in Figure 2 to a maximum of 300ƒC.
Recording was continued until all the material of interest had
evaporated. Typical evaporation profiles for the molecule ions of
hypoxanthine, xanthine and uric acid evaporated from normal muscle are
shown in Figure 2. The areas of each profile could then be related to
the absolute concentration of its precursor molecule. Allopurinol and
oxipurinol were distinguished from their equally volatile structural
isomers hypoxanthine and xanthine, respectively, on the basis of the
differing relative intensities of m/e 52.0187 and 54.0218 for the two
pairs of compounds.
Calibrations.
The
mass spectrometer was calibrated for each experiment by recording the
evaporation profiles for two sets of mixtures of known compositions, one
set consisting of compounds I-III only, the other comprising IV and
V.
In order to assess the effect of the carrier media on the precision of
the analysis, separate mixtures of I-III were diluted with deionised
water, anhydrous sodium sulfate, and desiccated muscle from which all
endogenous purine had been evaporated. The concentrations of these
mixtures ranged from 10-1000 ng/mg. Because of the very low solubility
in water of compounds IV and V, sodium sulfate only was used as their
diluent. Calibration mixtures containing similar concentrations of
caffeine (1:3:5 tri-N-methyl
xanthine VI) in both methanol and sodium sulfate were used to compare
the precision of determination and detection limits of a relatively
nonpolar purine with those obtainable for the more polar compounds I-III.
Figure 2. Evaporation
profiles of hypoxanthine, xanthine, and uric acid.
Ordinates denote the instantaneous molecular ñ ion intensities
measured sequentially on three channels at the probe temperatures
indicated Results
Instrument
Performance.
To achieve successful measurements of integrated abundance for a
number of ion beams simultaneously and at high resolution, the outputs
of the analyser power supplies and ion current amplifier had to remain
constant to a high degree over prolonged period of time. With the
present arrangement, the stability of the analyzer, including the peak
preselector, was sufficient to maintain a peak in the centre of the
display oscilloscope to within a distance equivalent to a ±5
ppm mass difference for a period about 8 hours without intermediate
adjustment. Over the same period of time, changes in mass spectrometer
sensitivity remained less than 5% as measured by the constancy of the
ion currents derived from the internal standards. A prerequisite for
this performance was the control of the ambient temperature to within ±2ƒC. The routine examination of biological samples
caused only a slight (about 20%) deterioration in sensitivity, at
constant 20,000 resolving power, over a period of six months. Throughout
this time, the ion source was baked for about six hours each nigh. Since
the spectrometer was calibrated on a day-to-day basis, the analytical
accuracy was not affected.
Calibrations.
Linear
relationships were found between the areas of the molecular-ion profiles
of compounds I-V and the corresponding weights of material evaporated
over the concentration range investigated. In Figure 3 the mean
percentage deviations of the experimental points from the appropriate
regression lines are plotted against concentration expressed as ng/mg of
sample (ppm) of caffeine, hypoxanthine, xanthine, and uric acid both in
solution and in solid mixtures with sodium sulfate. The use of purine-free
muscle as a diluent gave results indistinguishable from those obtained
with sodium sulfate. Part of the total observed error is attributable to
inaccuracies in the preparation and admission to the mass spectrometer
of the standard solutions and mixtures. The maximum estimated errors
from these sources are also shown in Figure 3 (dash curve).
Analyses.
The
analyses of some typical mixtures of the 5 compounds in known
concentrations are presented in Table II. With very few exceptions, the
overall error for concentrations above 100 ppm was within ±10%
and ±20% for concentrations less than 100 ppm. Discussion
Precision
of Measurement. An
examination of Figure 3 shows that for a relatively nonpolar material
such as caffeine, there is no essential difference in the precision of
measurement of a solution or a solid mixture of the same concentration
provided the latter is thoroughly mixed. The minimum detectable
concentration of caffeine in each case was about 0.5 ppm under the
present conditions of measurements. It was not possible, of course, to
increase the sensitivity considerably by simply increasing the mass
spectrometer gain. It was not possible, however, to introduce
subnanogram quantities of material into the mass spectrometer in a
sufficiently reproducible manner for proper calibration. Consequently
the precision of measurements under such conditions was very poor and
any figure quoted for a minimum detectable concentration became
questionable. A more useful concept, therefore, for quantitative
purposes is the smallest measurable
concentration (2 ppm in the case o caffeine) which could be measured
with a precision of ±10%
or better. At least half the observed error could be accounted for by
handling inaccuracies. The remainder was most probably a combination of
variation in mass spectrometer sensitivity (contributing not more than ±5%
for concentrations of caffeine less tan 20 ppm) and errors in the
integration procedure. Several methods of integration of the evaporation
profile were attempted (e.g., weighting a cut-out of the profile shape
and numerical integration by Simpsonís rule), but the most convenient
was to determine simply the sum of the recorded ordinates. Provided at
least ten ordinates were obtained per profile, this method was as
satisfactory as the others.
In
the case of the more polar purines I-III, the precision of measurement
was less and showed marked dependence on the method of
introduction. When aqueous solutions were used, the minimum
measurable concentration was as high as 30 ppm while the error increased
much more rapidly for smaller amounts than was observed for solutions of
caffeine. In addition the solid residue from solutions of caffeine I-III
usually required excessively high temperatures (>350ƒC) for vaporization and gave profiles with prolonged
tailing. This appeared to be due to adsorption of the polar purines on
the surface of the gold sample container of the inlet. These gold
containers were normally regarded as having negligible surface activity
but especially after prolonged cleaning the surface activity was very
pronounced. Surface
deactivation took place after a container has been used for 3-4 samples,
provided it was not heated to more than 300ƒC in between. Consistent
evaporation profiles usually could then be obtained but the mechanism of
the deactivation process remains unclear.
Containers made from borosilicate glass proved equally prone to
surface activity and were not improved by standard silanization
procedures.
By
contrast, the profiles of I-III from muscle, plasma, or sodium sulfate
exhibited much less tailing, were of a more consistent area, and
required lower vaporization temperatures than did those from aqueous
solutions. This was taken
as evidence that essentially complete evaporation of the purines took
place and only negligible amounts were retained by the tissue and plasma
proteins. This was further
indicated in Figure 3, where the minimum measurable concentration of
I-III in a solid mixture
was now 10 ppm. Their error
curve was much more closely parallel to that of caffeine indicating a
much reduced adsorption of the polar purines on the surface of the
sampke container. Some
adsorption on the sodium sulfate undoubtedly took place, however,
accounting for the dereased measurement precision compared with caffeine
if the solid mixture was allowed to stand for
more than 24 hours. Best results were obtained from mixtures used
immediately after preparation.
The
error curves of IV and V in sodium sulfate mixtures were closely similar
to those of I-III and the same considerations apply.
Overall Accuracy. Contributions to the total overall error (Table II) in the simultaneous determination of compounds I-V probably arose from two main sources besides the calibration errors. Nevertheless, the results shown in Table II indicated that with very few exceptions, the total error in the analysis of the test mixtures at concentrations down to 50 ppm was approximately twice the calibration error for a given component. Consequently the error in measuring such five-component mixtures at the 10-ppm level was probably no more than ± 20%. When compared with the natural variation of purine levels within a group of normal indivuals (Table III and Figure 4), this error is not considered to be excessive. Measurements on Natural Specimens. In Table III, the mean measured plasma oxypurine (hypoxanthine plus xanthine) level for five normal individuals is 0.17 ± 0.08 mg/100 ml measured by enzymatic procedures. The corresponding figure for uric acid of 2.5 ± 0.7 mg/100 ml cannot be compared with the normal range of 4-6 mg/100 ml. The enzymatic method measures the total uric acid and sodium urate in plasma but at blood pH 7.4, almost all the uric acid is present as the sodium salt and, hence, undetectable by mass spectrometry. However there is good evidence that certain of the plasma proteins can form loosely bound complexes with uric acid. For normal individuals, the concentration of uric acid bound in this way has recently been reported to be 2.9 ± 0.4 mg/100 ml which compares well with the figure obtained by mass spectrometry8.
|
|
|