Introduction
Techniques of conventional vibrational spectroscopy (absorption/Raman) are routinely used as analytical tools in chemistry. However for samples of biomolecules, e.g. peptides and proteins, the 1D spectra are often too congested or broadened for detailed analysis. As an optical analogue of 2D NMR, coherent 2D infrared spectroscopy generates spectra in two dimensions, greatly reducing the complexity. A particular form of coherent 2D-IR spectroscopy known as DOVE-FWM (DOubly Vibrationally Enhanced Four Wave Mixing) spectroscopy is being developed as a powerful analytical technique for biomolecules. Yet in order to reach its full potential for structural and compositional analysis, a better understanding of the factors that contribute to experimental spectra is required. For this purpose the well-studied benzene was used as a benchmark molecule, then the 2D-IR spectra of several amino acids were investigated.

Principle of 2D-IR DOVE-FWM (DOubly-Vibrationally Enhanced Four Wave Mixing)
To obtain a 2D-IR spectrum, the sample is excited by a sequence of three laser pulses ωα, ωβ and ωγ, and a signal is recorded at ωδ= ωβ - ωα+ ωγ. ωα and ωβ are scanned to generate the 2D spectrum.
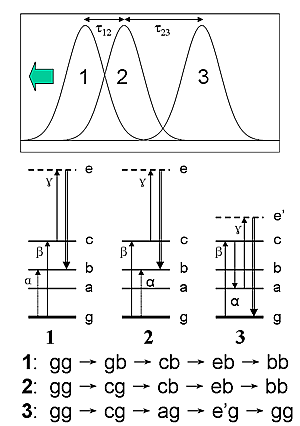
Figure 1.
The figure 1 shows the laser sequence and the corresponding wave-mixing energy levels (WMEL). Also shown are the Liouville pathways involved in 2D-IR spectra. 1 and 2 are usually called two DOVE-IR pathways, and 3 DOVE-Raman pathway.
Like conventional vibrational spectroscopy, there are also selection rules for cross-peaks in 2D-IR spectra: 1) the transition corresponding to ωα must be IR-active; 2) the transition corresponding to ωβ in most cases is to a combination band, so it must contain an IR-active species; 3) transition corresponding to ωβ – ωα must be Raman-active.
With time-dependent perturbation theory and non-linear optical theory, the third-order non-linear susceptibility related to 2D-IR spectra can be written as:
To understand the nature of 2D-IR cross-peaks, it is insightful to express the susceptibility as its two constituents:
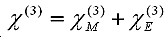
The first term is the mechanical contribution to the susceptibility which originates from anharmonic coupling between the two vibration modes i and j:
 and and 
The second term comes from the anharmonicity of molecular dipole moment:

Thus cross- peaks between two vibration modes will not appear if all these anharmonic parameters vanish. The calculation of then lies in the calculation of these anharmonic parameters of the molecule.
The influence of the finite pulse-width of the laser pulses on the lineshapes of 2D-IR cross-peaks was incorporated in the following response function equation (for pathway 1, with similar equations for the other pathways):

Example: benzene
Gaussian 03 (Revision D.01) was used in the calculations. After geometry optimization at B3LYP/6-311++G(d,p) level, numerical differencing was used to obtain the second derivatives of dipole moment and cubic anharmonic coefficients, which were used to calculate the susceptibility. Large spectral areas were scanned for 2D-IR cross-peaks. This method was used to calculated 2D-IR spectra of benzene and several amino acids.
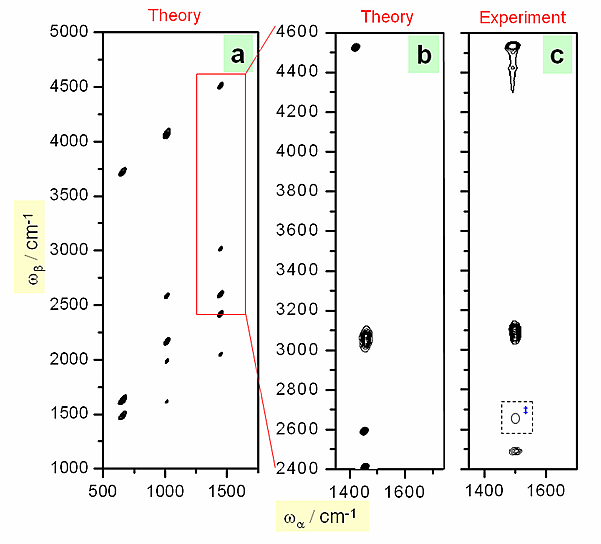
Figure 2.
Figure 2 shows the calculated 2D-IR spectra of benzene compared with experimental results. The agreement is excellent in the spectral region of available laser wavelength.
Fermi Resonances
When two vibrational states lie close to each other and symmetry allows, a strong perturbation called Fermi resonance sets in. While in conventional spectroscopy Fermi resonances are often difficult to discern, in 2D-IR spectra, existence of Fermi resonance can be readily and directly detected through simple changing of laser sequences:
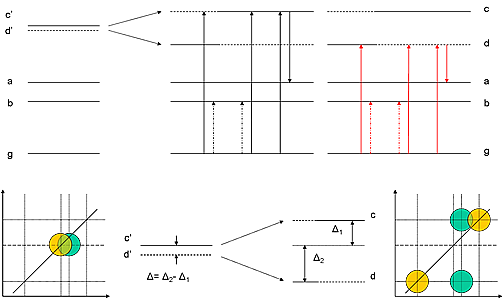
Figure 3.
Figure 3 shows WMEL for one possible case of Fermi resonance with an unperturbed dark state d’ lying below the bright state c’ (ωγ and ωδ not shown):
1) with ωα following ωβ, all DOVE-IR and DOVE-Raman pathways are open, and the 2D-IR cross-peaks will appear with a characteristic trapezoidal pattern as shown in the bottom-right scheme;
2) however with ωβ following ωα, only pathway 1 remains open (figure 1), so only the green peaks remain in the 2D-IR spectrum.
By measuring the splitting of the cross-peaks, energy shift caused by Fermi resonance can be directly determined. This is exactly what was observed in benzene 2D-IR spectra, here the states involved are c’= , and d’= , and d’= , and in a smaller extent a third state , and in a smaller extent a third state  . .
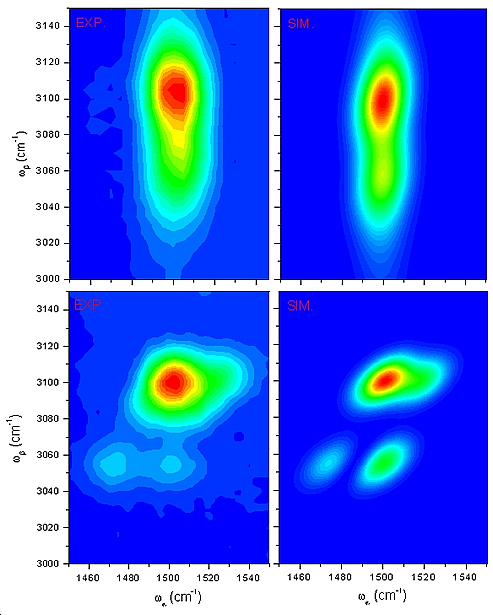
Figure 4: ωβ following ωα (first row), ωα following ωβ (second row)
Figure 4 shows the experimental 2D-IR spectra of benzene obtained with two different sets of laser sequences. At the right column are the calculated spectra. Mixing of the states was calculated through diagonalization of coupling matrix between the three vibration modes involved. The off-diagonal coupling terms come from DFT calculations.
Donaldson M. P., Guo R. & al, J. Chem. Phys., 2007, 127, 114513. |

