In this section you will calculate the wavefunction of a H4 clusters.
Exercise 1: Start DLVisualize, run a CRYSTAL calculation for the linear case: H4_linear.inp
Exercise 2: Run a CRYSTAL properties calculation of the energy level diagram for the H4 linear cluster, using the Band Structure module.
A prerequisite for calculating properties is to analyse a wavefunction,
otherwise the properties items are grayed out.
Calculate->CRYSTAL->Analyse Current Wavefunction
The Job List panel will open automatically and look something like this;

Select the job and the status line should
report "Job has completed" - like this;
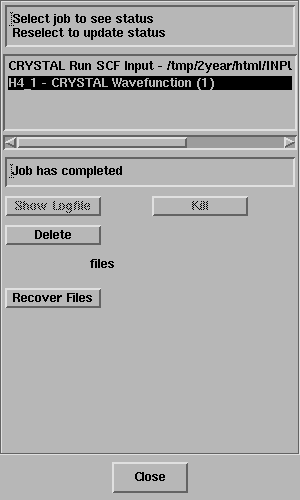
At this point, the properties calculation can be run.Click on Recover Files.
Select Calculate -> CRYSTAL -> Properties -> Band Structure.
The CRYSTAL Band Structure panel will open:

Select OK and the properties calculation will start
as evident from the Job List panel

Select the last job in the panel.
When the "Job has completed", click on Recover Files.
The 1D Data Display window will open:
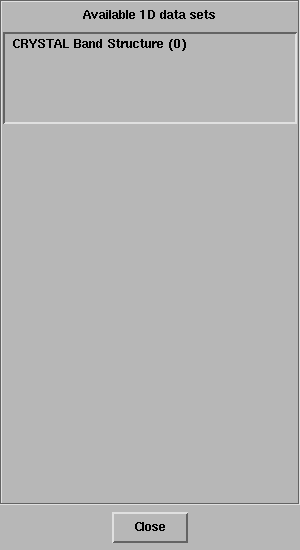
Once select the available 1D data set, click on the button Draw 1D data.
The following energy level diagram will be plotted.
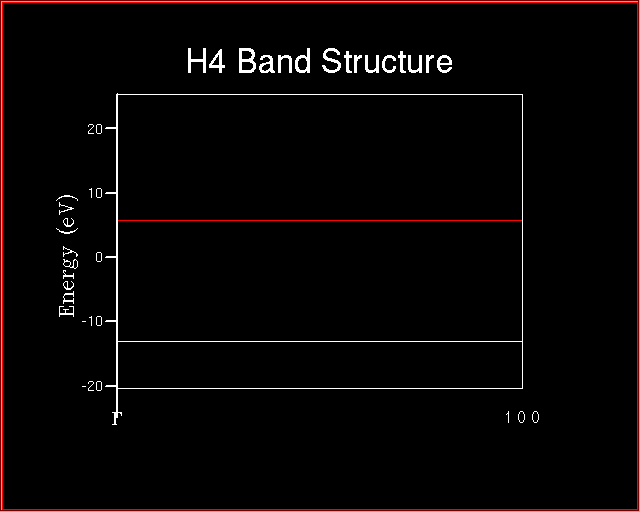
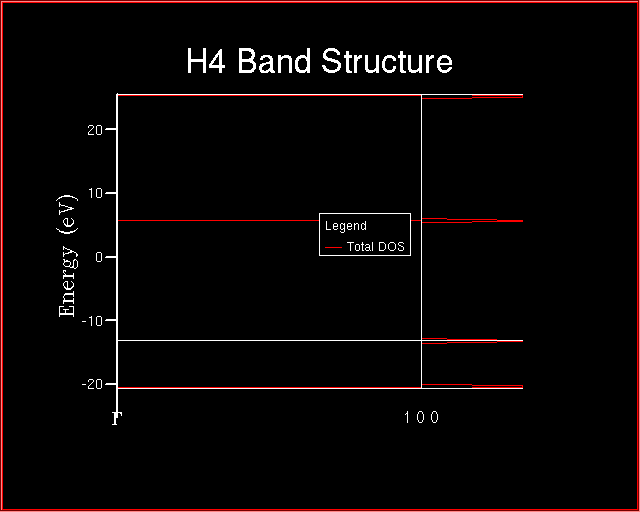
Each horizontal line corresponds to an energy level. One atomic orbital for hydrogen atom, then four atomic orbitals are combined to give four molecular orbitals. As it will be also evident at the end of Exercise 3 and 4.
Exercise 3: Run a CRYSTAL properties calculation of the density of states for the H4 linear cluster.
Select Calculate -> CRYSTAL -> Properties -> Density of States.
The CRYSTAL Density of States panel will open:
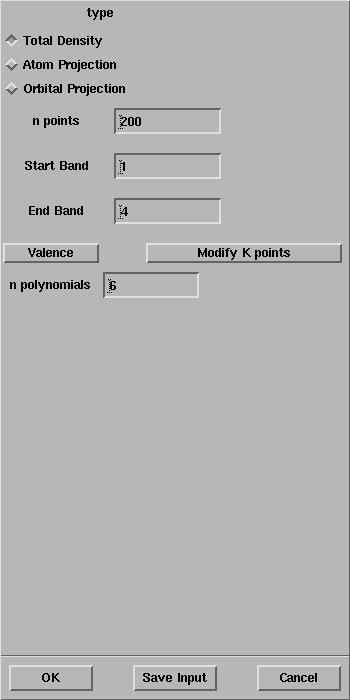
Select OK and the properties calculation will start
as evident from the Job List panel
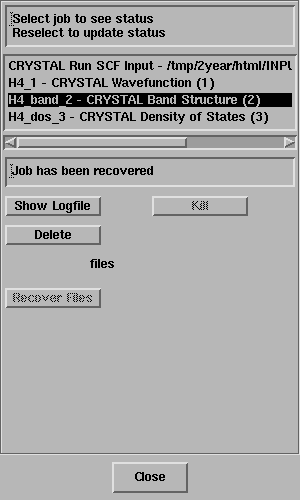
Select the last job in the panel.
When the "Job has completed", click on Recover Files.
The 1D Data Display window will open:
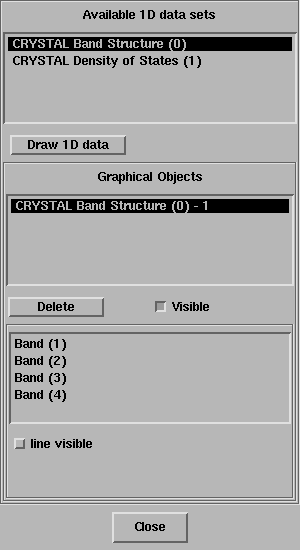
Once select the second available 1D data set, click on the button Draw 1D data.
The following Density of States will be plotted.
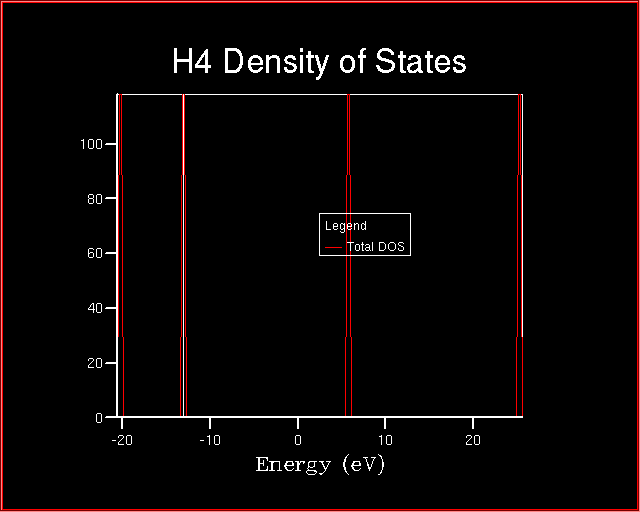
Which information can be obtained from a DOS plot?
DOS(E) dE = number of levels between E and E+dEIn fact, if the value of dE is varied, by changing the sampling point in the CRYSTAL Density of States panel (by decreasing the value from 200 to 50) the height of each peak is modified, but the product is the same and is equal to 1 in our case.
Exercise 4: Run a CRYSTAL properties calculation of the energy level diagram + the density of states for the H4 linear cluster.
Select Calculate -> CRYSTAL -> Properties -> Bands + DOS.
The CRYSTAL Bands + DOS panel will open:
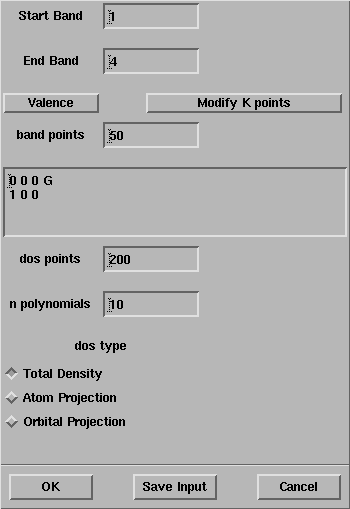
Select OK and the properties calculation will start
as evident from the Job List panel

Select the last job in the panel.
When the "Job has completed", click on Recover Files.
The 1D Data Display window will open:
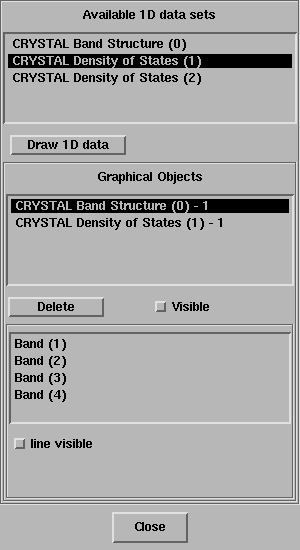
Once select the last available 1D data set, click on the button Draw 1D data.
The following energy level diagram will be plotted.
